Cold starts on Modal: smaller model state did not show faster cold requests
What Diffio’s Modal experiments showed about GPU snapshots, quantization, CUDA graphs, transcription dependencies and cold-request latency.
Diffio’s deployment experiments ran from July through September 2026 on our audio-restoration service, with two models: Diffio 2.0 and Diffio 3.5.
The two models, and why they optimize differently
Diffio 2.0 uses ahead-of-time compiled model packages; Diffio 3.5 also has an autoregressive language-model path and a diffusion component. The general next-token diffusion architecture explains why the autoregressive loop and diffusion head offer different optimization boundaries.
| Change | Result | Evidence |
|---|---|---|
| GPU snapshots | gain | 0.4 s vs 22.5 s finalization |
| ScoreQ warmup | gain | 35–36 s moved before capture |
| CUDA graphs | gain | median 16.445 → 12.916 s |
| Independent transcription | gain | 2.0 frees the GPU early |
| Repository pruning | unproven | snapshot size not measured |
| ScoreQ allocator shrink | unproven | inconclusive, 10 pairs |
| Broader compilation | unproven | no request reduction |
| HQQ, NVFP4, AWQ-lite, INT8 | rejected | failed quality |
| Acoustic INT4 | rejected | slower in 6 of 7 pairs |
| Region pinning | stopped | worse scheduling |
| September research environment | Configuration |
|---|---|
| GPU | RTX PRO 6000 Blackwell |
| Runtime | PyTorch 2.9, CUDA 12.8 |
Final smaller-state candidates: cold request change
Median paired completion change on a 60 s input, with 95% bootstrap intervals
ScoreQ allocator shrink, Diffio 3.5 (10 matched cold pairs)
Median −6.20 s; 95% interval −63.00 s to +77.84 s
Acoustic INT4 MLPs, Diffio 2.0 (7 matched cold pairs)
Median +5.74 s; 95% interval +4.47 s to +66.32 s
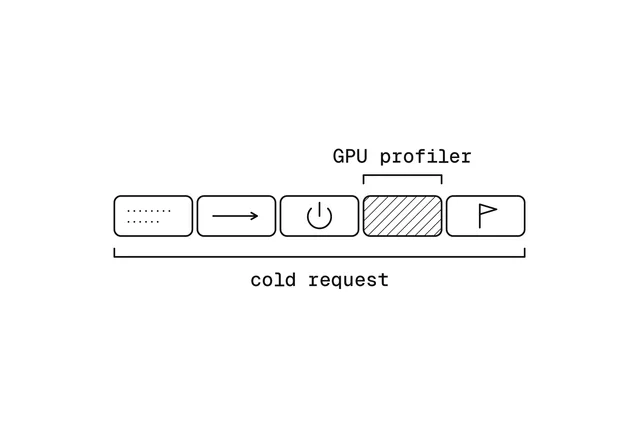
A cold request includes work that a GPU profiler cannot see
Some stages of a cold request overlap, so adding their elapsed times can double-count the same wall-clock interval.
One cold request, start to finish
- Preparesource preparation, transcription
- Dispatchdispatch, platform waiting
- Startworker startup
- Runmodel execution
- Finishpublication, then a join that waits for every required output
What each measurement establishes, and how a request counted as cold
A cold request spans source preparation, transcription, dispatch, platform waiting, worker startup, model execution, publication, and a completion join that waits for all required outputs.
| Measurement | What it establishes |
|---|---|
| Snapshot creation | The cost of building a reusable initialized worker state. |
| Restored cold request | The first request handled by a newly restored worker. |
| Same-process warm request | Reuse of a worker that has already handled a request. |
| First playable audio | In the final study, the client downloaded and decoded the first AAC segment; this did not measure audible browser playback. |
| Complete request | The instrumented client observed the complete workflow, including required transcript and artifact publication. |
| GPU kernel interval union | The elapsed union of GPU kernel intervals, counting overlapping kernels once. It excludes CPU and remote waiting. |
A restore flag alone cannot classify a request as cold: the second request in that process still inherits a worker that originally restored from a snapshot. We required distinct worker identities, evidence that the previous worker was gone, and platform restore events. Snapshot-creation attempts remained in the attempt journal but outside the restored cohort.
The boundary labeled “physical start” also needed verification. The final harness preferred Modal’s restore-start system log, which was not always an operating-system process-creation timestamp. Its interval to the start of application finalization is therefore a restore-to-finalization-start proxy, not an isolated measurement of checkpoint copying. Submission to that event can include placement, image preparation, retries, and other platform work.
GPU snapshots avoided package loading and ScoreQ initialization
GPU snapshots pay off when restoring initialized state costs less than repeating the computation that built it.
First-use work moved before capture
- 6.97 sloading compiled packages in the first 2.0 control trace
- 35–36 sScoreQ’s first production-shape ONNX inference
Why the first request was slow, what Modal’s snapshots do, and what we refreshed after restore
In our July probe, application finalization took about 0.4 seconds after a GPU-plus-CPU snapshot, compared with about 22.5 seconds after a CPU snapshot.
Our early 2.0 worker still loaded its compiled packages on the first restored request, despite preparing their files during image construction. ScoreQ, the learned audio-quality scorer used by the service, had an even more expensive first-use path: its first inference overlapped word-to-audio alignment enough to make that stage look slow, and warming alignment alone did not remove the delay. Exercising ScoreQ’s actual input shape before capture moved its convolution-search and initialization work out of the first restored request.
Modal’s current snapshot documentation places pre-capture work in @modal.enter(snap=True) and describes GPU snapshots as an alpha feature. Snapshots use the same distributed storage system as Images and Volumes, so storage-bandwidth-limited weight loading may gain little.
After restoration, the worker created fresh credentials, network clients, runtime threads, and random identity. Retaining reusable computation while refreshing externally meaningful state avoided reusing captured connections or a creator’s random stream.
Snapshot creation still has a cost. Our candidate spent longer preparing its initial reusable state, and creation can recur when code, configuration, or platform conditions change.
The July comparison is small and historical: it measured finalization, not total request latency, and used separate, unpaired groups of six CPU-snapshot and eight GPU-snapshot observations.
The earlier bundle lowered median completion but delayed the 3.5 preview
Bundling six changes cut median complete-request time for both models on a 60-second input, but the 3.5 preview arrived later.
What the bundle changed, means, faster pairs, and what the preview timing measured
The September combined optimization changed compiled-package preload, ScoreQ warmup, redundant model copies, allocator state, CPU memory reservation, and the 3.5 diffusion execution path together, so it does not isolate any individual change’s contribution.
| Model | Median complete request, control → bundle | Mean complete request, control → bundle | Faster candidate pairs |
|---|---|---|---|
| Diffio 2.0 | 61.934 → 33.093 s | 64.100 → 33.124 s | 10/10 |
| Diffio 3.5 | 85.350 → 45.604 s | 85.232 → 85.243 s | 7/10 |
The 3.5 mean stayed flat despite its lower median because capacity-related outliers remained. The HLS (HTTP Live Streaming) preview time measured when a playlist or segment was advertised, not successful download and decoding. The preview and completion medians use different subsets, so their relative ordering is not a per-request ordering.
Repository pruning did not measure snapshot shrinkage
Pruning shrank the repository, compiled constants and device memory; snapshot size itself was not measured.
Removed by pruning
- 4.04 GBunused legacy GPU-architecture packages, 2.0 repository
- 694 MBunused semantic tokenizer and connector parameters, 3.5
How a model revision reaches a restored worker
- Publishimmutable Hugging Face revisions
- Verifycheck their file hashes
- Syncappend-only Modal Volume directories
- Buildimage construction prepares executables and caches
- Restoretrials run with Hugging Face downloads disabled
Why old revision directories stay in place
The removed 2.0 files were never active state on the tested GPU, and the 3.5 pruning left retained tensors unchanged. The model repository was our versioned release source, not a download repeated on every restored request. These studies measured repository, compiled-constant, or device-memory reductions; we did not measure serialized snapshot size.
Immutable revisions also protect restores and rollbacks. Hugging Face’s download API supports explicit commit revisions. Modal documents that changing a Volume does not invalidate its snapshots, and deleting files needed by a restore can break it. We therefore preserved old revision directories while live or rollback deployments could still depend on them.
The release identity combined source, model revision, image, and configuration. Development deployment and fixture checks preceded any promotion decision.
Compiled packages failed after the server passed health checks
A successful import, HTTP health check, or tensor allocation could miss all three failures below.
From compiled package to real audio: the three failure points
- Link system librariesfailed, packages needed
GLIBC_2.38; the image had 2.36 - Load wrapper librariesfailed, hardened loader rejected executable-stack flags
- Pick the ONNX providerCPU and GPU runtimes both installed; GPU goes last,
CUDAExecutionProviderrequired - Canaryload every required package and run real audio
Each failure and its fix, the execution provider, and why each GPU architecture needs its own package
The compiled shared libraries required GLIBC_2.38; the older image supplied glibc 2.36.
A newer image’s hardened loader rejected executable-stack flags on compiled wrapper libraries. We cleared them in image-local copies, rebuilt and checked the archives, and left pinned source artifacts intact.
Dependencies could install both CPU and GPU ONNX Runtime distributions. The final build installed the pinned GPU distribution last and required CUDAExecutionProvider, the backend that runs supported ONNX operations on CUDA.
Ahead-of-time compilation, which produces executables before serving, adds compatibility requirements beyond tensor shapes. Our packages targeted SM120, NVIDIA’s architecture identifier for the tested Blackwell GPU. A fallback GPU needed its own compatible package; an existing package for another NVIDIA architecture did not show compatibility.
CUDA graphs reduced diffusion runtime; broader compilation added first-use work
Graphs cut the median with decoded PCM identical on all 232 evaluation clips; broader compilation added first-use work.
First-use cost of compiling the whole language-model path
- ~117 sfirst use
- 62 son a new shape
How the graph was captured and checked, and why compile cost did not decide it
A CUDA graph records a GPU execution sequence for replay with stable memory addresses, reducing repeated launch overhead. We captured the deterministic 3.5 diffusion trajectory, generated its initial random noise outside capture, and kept graph inputs private. Moving decoder cache indices to the CPU also avoided repeated GPU-to-CPU lookups.
The integrated service exposed a failure that isolated graph code missed: alignment performed CUDA work on another thread during global capture. Thread-local capture restricted unsafe-operation error checks to the capturing thread, resolving this observed capture failure while preserving a single denoising scheduler and private buffers. It was validated as a complete configuration; changing the capture mode alone does not make shared buffers safe. PyTorch’s capture-mode documentation describes the different cross-thread error checks.
The selected graph matched baseline decoded PCM, the waveform’s numerical samples, across all 232 evaluation clips with frozen transcripts. Comparing WAV file bytes would have produced false differences because metadata timestamps changed.
Why the compilation cost alone did not decide it
The tested whole-Whisper compilation also added substantial compilation overhead on first use and on new input shapes. Compilation cost alone would not reject a configuration whose compilation could finish before capture; these tested configurations did not establish a reduction in complete-request latency.
Quantized storage, successful reload, and acceptable audio are separate gates
Only one quantized candidate, acoustic MLPs changed from INT8 to INT4, passed all three gates and advanced to restored cold requests.
Three gates every quantized candidate had to pass
- Packed storagephysical packed backing storage and compiled constants inspected
- Fresh reloadeach candidate reloaded in a fresh process
- Audio quality232-clip evaluation against the deployed and BF16 models
| Full evaluation comparison (positive favors INT4) | Blend delta | ScoreQ delta |
|---|---|---|
| Acoustic INT4 vs current deployed model | +0.01678 | +0.01284 |
| Acoustic INT4 vs original BF16 model | +0.00514 | +0.00254 |
| Worst dataset change vs original BF16 | −0.03587 | −0.02554 |
Every tested family, how packing and quality were checked, and why this is not a ranking
| Tested family | Result that determined the decision |
|---|---|
| HQQ INT4 language projections, including smaller-group and MLP-only variants | Candidates that passed the initial small evaluation set failed broader quality evaluation. |
| Calibrated NVFP4 with GPTQ and INT4 with AWQ-lite | Successful packing and calibration still failed the tested audio-quality gates. |
| Selective INT8 language MLPs | Lost 0.283 blend points on SOVA despite a favorable aggregate. |
| Other tested lower-precision acoustic or codec variants | Tested variants failed quality or execution checks. |
| Acoustic MLPs changed from INT8 to INT4, retaining INT8 attention | Advanced to restored cold requests. |
Post-training quantization replaces trained weights with lower-precision representations, optionally using calibration recordings to choose the mapping, without fine-tuning the model.
MLP refers to feed-forward multilayer perceptron sublayers. HQQ, GPTQ, and AWQ-lite name the tested quantization recipes; NVFP4 is a four-bit floating-point format.
Our INT4 export initially failed to preserve packed storage. Tensor metadata could describe a low-bit object while copying into an ordinary floating-point destination reconstructed a larger representation. We inspected the physical packed backing storage and compiled constants, then reloaded each candidate in a fresh process. Earlier serialized candidates that reconstructed the expected tensor class had still failed output parity.
Correct packing alone did not establish an audio-quality pass. We compared frozen inputs and transcript conditioning, first against the current deployed model and then against the original BF16 model to measure cumulative change. The full evaluation contained 232 clips; the final acoustic-INT4 candidate also passed a fresh 32-recording confirmation set.
Quality decisions used UTMOS and WVMOS, learned predictors of perceived speech quality, averaged into a dataset-balanced blend, together with ScoreQ as a separate learned score. The provisional limits allowed at most a 0.02 drop in each aggregate and a 0.05 drop on any dataset. An improved aggregate could not override a failed dataset threshold.
Why this is not a ranking of quantization methods
These are component- and recording-specific results, not a ranking of quantization methods.
The automated gates did not establish perceptual identity; no human listening verdict was recorded. Recognition-based checks likewise could flag numerical-word disagreements but could not resolve them without checking what was actually spoken.
The final smaller-state candidates did not meet the cold-latency gate
Neither candidate met the cold-latency gate: the ScoreQ allocator shrink was inconclusive, and acoustic INT4 completed slower in six of seven pairs. The interval chart at the top of this post shows both results.
Final cold-study protocol
- 60 sinput duration
- 1 s and 5%minimum median completion improvement (practical target)
- 10matched pairs planned per candidate
Neither candidate qualified for the planned additional cold tests at other input durations or a cold-latency release.
The paired results as a table, how the pairs were measured, and why the results stopped where they did
| Candidate | Measured reduction | Matched cold pairs | Median paired completion change, with 95% bootstrap interval |
|---|---|---|---|
| ScoreQ allocator shrink, 3.5 | 512 MiB device memory in the local probe | 10 | −6.20 s [−63.00, +77.84] |
| Acoustic INT4 MLPs, 2.0 | 130,170,880 compiled constant bytes | 7 | +5.74 s [+4.47, +66.32] |
The final study compared candidates against controls with the earlier deployment improvements already in place. Acceptance required the specified median completion improvement, a paired interval supporting improvement, passing quality, and no clear first-playable regression.
The allocator candidate asked ONNX Runtime to release unused ScoreQ arena memory while retaining its session and caches. The acoustic candidate quantized the original BF16 weights directly, avoiding requantization of the lossy INT8 representation.
Changes are candidate minus matched control; negative favors the candidate. Pairs used the same frozen input and workflow settings, interleaving control and candidate and reversing their order on alternating pairs. The intervals describe the paired median and come from resampling whole matched pairs. The acoustic candidate’s interval describes a sample stopped under a futility rule introduced during collection, so it lacks guaranteed fixed-sample coverage. Creator counters repeated after a restore are frozen metadata rather than new memory observations.
Why the allocator result is inconclusive and acoustic INT4 stopped at seven pairs
The allocator’s mean completion change was slower by 11.66 seconds, and its median restore-to-finalization-start proxy changed by only −0.096 seconds. The favorable completion median did not establish that less retained memory restored faster.
Acoustic-INT4 median first-playable time also worsened. We stopped further dispatches when the planned ten-pair median could no longer improve, even with arbitrarily good remaining pairs. The best possible median was still +4.54 seconds. One request already in flight finished and remained unmatched, outside the paired statistics.
The local warm slowdown was much smaller than the complete-request difference:
Full warm-duration table, how it was measured, and why the artifacts were kept
The acoustic candidate’s local warm slowdown was much smaller than its complete request difference. The alternating-process RunPod diagnostic measured model execution, excluding transcription, ScoreQ, Modal restoration, transport, and output-file writing.
| Input duration | Current model | Acoustic INT4 | Added model time |
|---|---|---|---|
| 3 s | 2.126 s | 2.334 s | 0.208 s |
| 30 s | 2.128 s | 2.305 s | 0.177 s |
| 60 s | 2.131 s | 2.318 s | 0.187 s |
| 300 s | 6.469 s | 7.034 s | 0.565 s |
The diagnostic made 48 calls. Excluding the first call per duration in each process left 32 calls, with four observations per table cell.
The compiled model processes fixed 120-second windows, padding shorter inputs. The three shorter fixtures therefore each execute one window; the longest executes three, explaining the nearly flat short-input timings.
We retained the candidate’s artifacts so its lower storage requirement and higher execution time could be reproduced. Attributing the entire cold-request regression to low-bit kernels would conflate the local compute penalty with platform and workflow variability.
Waiting before restoration dominated the largest observed delay
In the slowest observed request, about 776 of its roughly 845 seconds passed before Modal logged the restore start; finalization began about six seconds after it.
Slowest allocator-control request, about 845 s in total
- GPU submissiontranscription had already completed
- Waiting, about 776 spending call, no worker task binding
- Restore startModal’s explicit restore-start log
- Finalization startabout 6 s after the restore event
The state reductions did not establish an improvement in that waiting interval.
What the timing does not identify, and other scheduling observations: region pinning, GPU fallback, memory reservation
The timing places most of that delay before the recorded restore event without identifying which platform operation consumed it. Both arms experienced long waits, and we retained them in the paired sample.
An earlier region-pinned arm had worse scheduling observations and was stopped. A cheaper GPU fallback offered no measured advantage and introduced a different architecture to support. Reducing the CPU memory reservation was eventually viable for the changed bundle, but an earlier comparison had favored the larger reservation’s scheduling. Initialization peaks, steady memory, placement, and cost were separate constraints.
Independent transcription let Diffio 2.0 release the GPU before the job finished
Moving speech recognition off the GPU removed about 1.89 GB per model but made warm completion slower; Diffio 2.0 now releases the GPU without waiting for the transcript.
A Diffio 2.0 job with independent transcription
- Dispatchaudio restoration runs independently of transcription
- Publishrestored audio is published and the GPU invocation released
- Join on CPUaudio and transcript checked as the same operation
- Completethe job succeeds once both are valid
Why Diffio 3.5 could not do the same, and how the coordinator works
The worker waited for remote transcripts, which made warm completion slower. Each warm mean uses two subsequent calls in the same process.
The offload removed a separate ASR and alignment package; ASR means automatic speech recognition, and the acoustic Whisper encoders used by restoration remained necessary. Single-run GPU profiles showed less kernel execution after offload, but those profiles were separate single observations, not a performance distribution. Moving work to another service changed which resource performed it without removing it from the completion dependency graph.
Diffio 2.0 allowed restoration and transcription to execute independently because its restored audio does not require the external transcript. We dispatched audio restoration independently, let it publish and release its GPU invocation, and completed the job on the CPU after both audio and transcript were valid. Tests that deliberately held back transcript-provider responses verified that ordering for short and long inputs, rather than measuring a new latency distribution. Diffio 3.5 still depended on canonical transcript conditioning, so it could not inherit the same independence. An earlier evaluation using external transcripts also failed a dataset quality threshold.
The CPU completion coordinator checked that audio and transcript belonged to the same operation before marking the job successful. It prevented uncertain dispatch from duplicating GPU work, respected cancellation and later transcript edits, and charged usage once. Audio availability and full-job completion became separate states.
CPU preparation could remain slow even on a reused instance. One roughly ten-second extraction/upload interval occurred after that instance had handled 157 earlier requests, so it did not support attributing the delay to an empty container’s initialization. Phase telemetry was needed to distinguish media work, storage round trips, and time between stages.
Retention and testing budgets depend on reuse and information gained
In a small production sample of nine events, the shortest observed gap exceeded 22 minutes, so the sample gave no evidence that keeping workers a few extra minutes would often avoid a restore.
Retention and testing costs
- > 22 minshortest observed gap in nine production events
- $0.31about five extra warm minutes at the listed rate
- $4.43final Modal billing checkpoint, cold-quantization study
Where each test ran
RunPod, already allocated GPU
- calibration, packing, fresh reload
- audio quality, profiling, duration checks
Modal, paid calls: what local processes could not reproduce
- snapshot creation and restore
- platform waiting
- the complete deployed workflow
Retention controls, and how the retention and billing figures were calculated
Keeping a container warm allows reuse if another request arrives before shutdown. Modal’s autoscaler controls expose minimum warm containers, an active buffer, and an idle scale-down window. Interleaved controls, frozen revisions, explicit exclusions, and preserved failures made the paid calls interpretable.
| Retention estimate, September 8, 2026 listed rates | Value |
|---|---|
| Requested resources | RTX PRO 6000, 8 physical CPU cores, 32 GiB memory |
| Combined requested-resource rate | $0.001018/second |
Keeping that allocation for five extra minutes would cost about $0.31; actual metered usage and billing policy determine the invoice.
The final three-app Modal billing checkpoint for the cold-quantization study was $4.43. It could lag usage and excluded RunPod, the separate CPU workflow, and external ASR.
Sources
- Diffio deployment measurements
- Modal Memory Snapshots
- PyTorch 2.9 CUDA graph API
- ONNX Runtime CUDA execution provider
All 7 sources and what each supports
- Diffio deployment measurements: original study methods and quality gates, anonymized final paired timings, initialization and packaging evidence, the earlier bundled comparison, warm-duration and transcription results, and the cold-study billing checkpoint. The experiments are dated; they are not a benchmark of every Modal configuration.
- Modal Memory Snapshots: lifecycle hooks, CPU/GPU snapshot behavior, storage-bandwidth limitations, captured randomness, and Volume dependencies in the snapshot and artifact sections.
- PyTorch 2.9 CUDA graph API: replay and capture-mode semantics in the CUDA graph section.
- ONNX Runtime CUDA execution provider: CUDA provider selection and convolution-algorithm search underlying the ScoreQ and packaging sections.
- Hugging Face Hub downloads: immutable revision selection in the artifact-release section.
- Modal scaling: retention controls in the retention section.
- Modal pricing: the dated resource-cost calculation.