We measured the sound of 1,438 podcasts: the charts don't sound better than the long tail
A measured study of speech quality in 3,525 podcast episodes: chart shows match long-tail shows, genres differ, and the same shows have barely changed since 2017.
The two players above are what this study's scale sounds like: a December 1941 Library of Congress disc scores 2.50 as it survives and 4.40 after cleanup with Diffio. The podcasts below were measured as published, with no cleanup of any kind.
Podcasters talk about audio quality constantly, and most of the numbers quoted about it are survey answers: what listeners say puts them off. I couldn't find anyone publishing what podcasts actually sound like, measured, across a large sample. So at Diffio AI we measured it.
We ran a speech quality model over 3,525 English-language episodes from 1,438 shows: shows on Apple's US genre charts, shows outside them, and a panel of chart shows traced back to 2017.
The numbers
| Finding | Figures |
|---|---|
| The charts and the long tail sound the same. | The latest episode of a chart show has a median score of 4.06 out of 5. An active show outside the charts also has a median of 4.06. |
| About 1 in 5 chart episodes score below 3.5 | 19.2% below 3.5, and about 1 in 14 below 3.0 (7.0%). For long-tail shows: 15.8% and 4.4%. |
| Chart position barely matters. | Top 10 of their genre: median 4.09. Ranked 51 to 100: 4.05. The top 10 do have fewer weak episodes: 12.7% below 3.5, against 20.1%. |
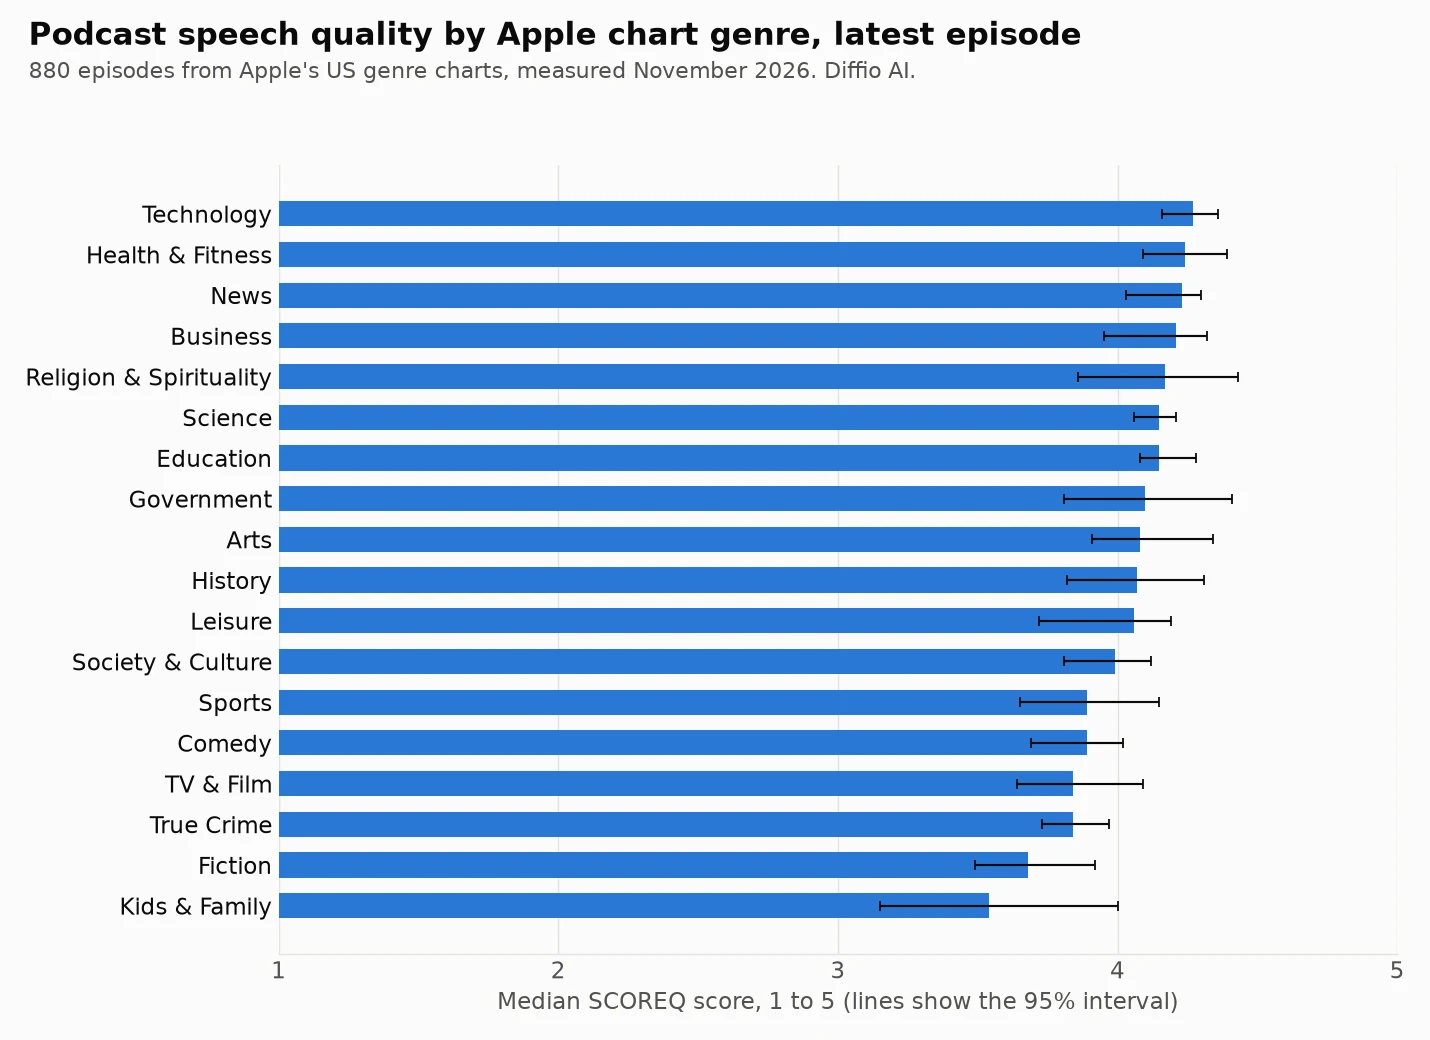
| Genre matters more. | Technology has the highest median at 4.27. Kids & Family has the lowest at 3.54. |
| Ten years have changed little. | The same shows moved from 3.85 in 2017 to 4.00 in 2026, on a five-point scale. |
| The pandemic left no mark. | From 2019 to 2020, when many shows moved to remote recording, the same shows changed by +0.05 (95% interval -0.05 to +0.14), which can't be told from no change. |
| Bitrate tells you nothing about the score. | Episodes at 64 kbps or less: median 4.06. Episodes above 200 kbps: 4.07. |
What the score means
The score comes from SCOREQ, a no-reference speech quality model: it listens to speech and predicts a quality score from 1 to 5 without needing a clean copy to compare against. It's a model's prediction and not a panel of human listeners, so read it as a consistent yardstick.
For scale: the 59 real-world noisy recordings in our speech enhancer benchmark, full of echo, wind, crowds and hum, average 2.31 before any cleanup. A typical podcast at about 4 is well clear of that. A score under 3 is closer to that territory than to a good studio recording. The disc at the top of this page gives you both ends by ear.
Genre: talk shows score highest, produced shows lowest
| Genre | Episodes | Median | Below 3.5 |
|---|---|---|---|
| Technology | 51 | 4.27 | 5.9% |
| Health & Fitness | 39 | 4.24 | 7.7% |
| News | 50 | 4.23 | 8.0% |
| Business | 52 | 4.21 | 5.8% |
| Religion & Spirituality | 37 | 4.17 | 13.5% |
| Science | 62 | 4.15 | 17.7% |
| Education | 50 | 4.15 | 12.0% |
| Government | 46 | 4.10 | 13.0% |
| Arts | 40 | 4.08 | 12.5% |
| History | 51 | 4.07 | 29.4% |
| Leisure | 51 | 4.06 | 25.5% |
| Society & Culture | 44 | 3.99 | 20.5% |
| Sports | 44 | 3.89 | 20.5% |
| Comedy | 55 | 3.89 | 23.6% |
| TV & Film | 60 | 3.84 | 23.3% |
| True Crime | 50 | 3.84 | 14.0% |
| Fiction | 49 | 3.68 | 40.8% |
| Kids & Family | 49 | 3.54 | 46.9% |
These genres aren't equally comparable. The model scores speech, so music and sound effects under a voice can lower the score even when the production is excellent. We didn't separate those cases, and that may explain much of the low scores for Fiction and Kids & Family. Treat a low score in those genres as "the voice has company", not as "badly made". Technology, News and Business, on the other hand, are mostly plain talk, so their scores say more about the recording itself.
The same shows, 2017 to 2026
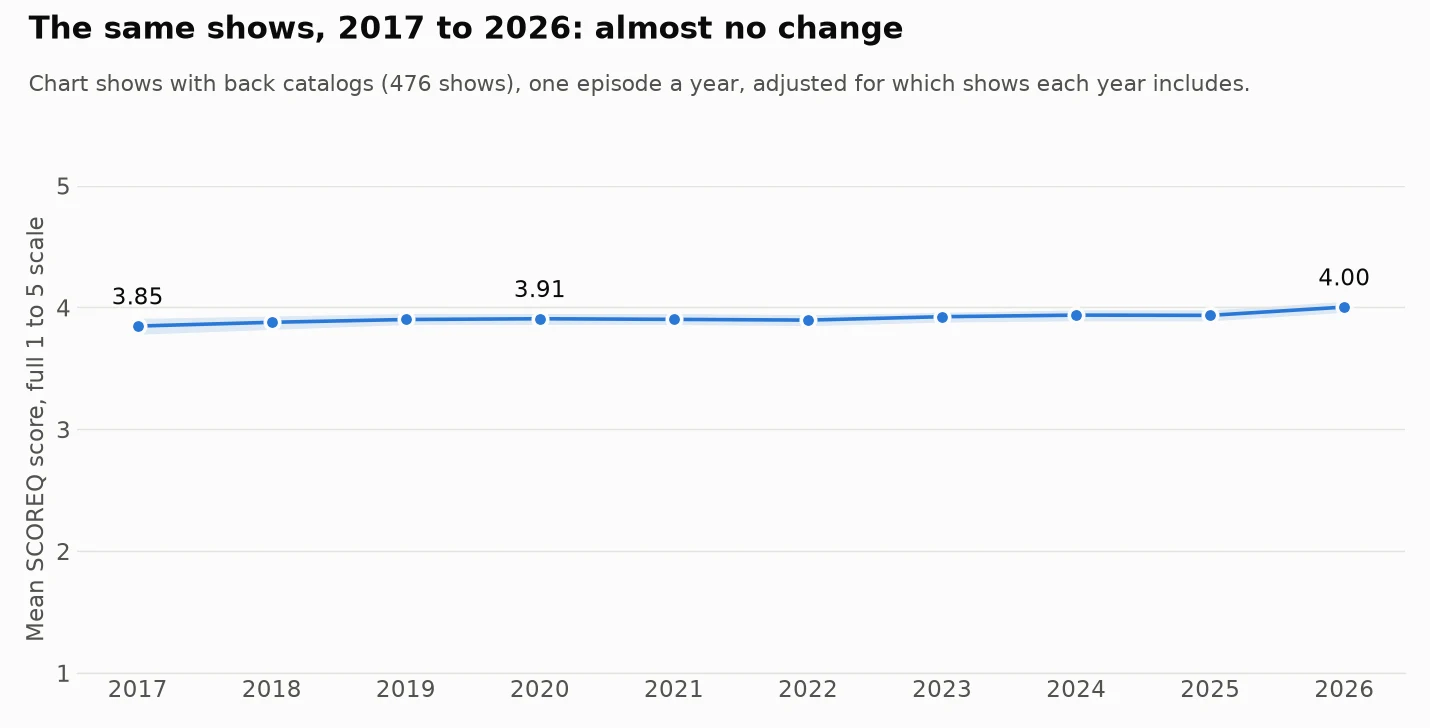
Microphones, remote recording platforms and AI cleanup tools all changed a lot over this period, so I expected to see it in the numbers. The line is almost flat, rising about 0.012 points a year. Comparing the same shows, 2019 to 2025 is +0.03 (95% interval -0.07 to +0.12), and 2019 to 2026 is +0.14 (+0.04 to +0.23). Most of the rise is in the last year, and I'd wait for another year of data before calling that a trend, partly because 2026 is the one year in which we took each show's newest episode.
A flat line doesn't mean nothing improved. It could mean the shows that were already on the charts in 2017 had already solved this, which is a limit of tracing chart shows backward.
How we measured it
| Parameter | Value |
|---|---|
| Shows | 1,438: Apple's US top 100 in each of 18 genres, plus active shows outside them |
| Episodes | 3,525 scored, of 3,669 drawn from 6,650 planned |
| Windows | 10,418: three 24-second windows per episode |
| Intervals | 95% bootstrap |
| Measured | November 6, 2026 |
How the shows, episodes and windows were chosen
- Shows. Apple's US top 100 in each of 18 genres, plus shows found through Apple's podcast search on 93 everyday words that aren't on those charts and released an episode in the last 120 days. We left out the Music genre, video feeds and feeds with a non-English language tag. The long tail here means active shows that search can find, not a random sample of every podcast.
- Episodes. The newest full episode of each show (8 minutes to 4 hours). For a random panel of chart shows, also the episode nearest September 30 of each year from 2017 to 2025. We planned 6,650 episodes in random order and stopped at 3,669, so the sample is a random part of the plan; 3,525 had enough speech to score.
- Measurement. Three 24-second windows per episode, at 30%, 50% and 70% of the running time, 10,418 windows in all, level-matched to the same loudness, with windows under 70% speech dropped. An episode's score is the median of its windows.
- Intervals. 95% bootstrap intervals. The year figures are adjusted for each show's own average, so a change in which shows are in the sample doesn't look like a change over time.
What this can't tell you
- It doesn't rank shows, so we name none. Three windows of one episode are a noisy read on a show: the first and last windows in an episode correlate at only 0.49, and a show's score in one year correlates with the next at 0.44. Averages over hundreds of episodes hold up. A single show's number doesn't.
- Ads get in. A window can land on a host-read or dynamically inserted ad, and old episodes can carry new ads. Taking the median of three windows reduces this but doesn't remove it, and it may flatten differences between years.
- It isn't about taste. A low score doesn't mean a show is bad or that listeners mind; listener behavior wasn't measured.
The data
Both result tables can be downloaded here. Please cite Diffio AI if you use them: genre results (CSV) and year results (CSV). We kept scores, not audio: every window was deleted after it was measured.
Our stake in this
Diffio makes speech cleanup software, so we have an interest in audio quality being a topic. No Diffio tool touched the podcast audio we measured, and nothing here tests or compares cleanup tools; the only Diffio output on this page is the 1941 example at the top. Our comparison of those is the speech enhancer benchmark, and it shows where we lost. If you want a number I didn't publish or want to check a figure, write to me at nathan@trydiffio.com.